This is an old revision of the document!
LESSON 10: Calculating a lookup table using algebraic/logical expression involving tables and values
Which Functors will you use in this lesson?
• Functors: Load Map and Save Map
we would like to demonstrate an example for calculate a lookup table using algebraic/logical expression involving tables and values on Dinamica EGO.
The intention of this example is answer two questions:
- In what year did the highest productivity for crop 3 occur?
- What was the value of this productivity?
We will use:
The Complete IBGE crop information Table (Dinamica EGO\Guidebook Dinamica_4\Models\Set_2\basics\IBGE_crop_information_complete.csv)
First, grab a “Load Table” and place it on the sketch. Double click the Load Table Functor and open the IBGE_crop_information_complete.csv file.
Now, we can switch the order of the year and crop columns. For this, grab a “Reorder Table Column” and place it on the sketch. Connect the Load Table to Reorder Table Column. In the Functor Editor window insert the index of the column to be moved (“1”) and the new column index.
Now, we can retrieve the harvested area per year corresponding to one of the crops. For this, first, grab a “Get Table from key” and place it on the sketch. Connect the Reorder Table Column to Get Table from Key. In the functor editor window, enter the chain of keys (“3”) identifying the sub-table that will be retrieved.
We can retrieve data column table corresponding to harvested area and data column table corresponding to production. For this, grab two “Get Table Column” functors and place it on the sketch. Connect the Get Table from Key to these two Get Table Column Functors. For the first Get Table Column, in the tab Column Index or Name, insert the index of the column to be retrieved (“2” or “harvested area”). For the second Get Table Column, in the tab Column Index or Name, insert the index of the column to be retrieved (“3” or “production”).
Now, grab two “Lookup Table” functors and place it on the sketch. Connect each one of these Get Table from key Functors to one Lookup Table to convert each one of these two tables to a lookup Tables.
Now, we will calculate the increase in harvested area between consecutive years. For this, grab a Calculate Lookup Table and place it on the sketch. Click in the hook tool and insert a Number Table inside on the Calculate Lookup Table. Assign a number to Number Value.
Now, Connect the functors Harvested Area and Harvested Quantify to Number Table.
Double-click on Calculate value to add an expression to calculate the increase in harvested area between consecutive years.
We used the expression:
t2[line] / t1[line].
Now, we extract attributes and summary statistics from a lookup table generated. For this, grab a “Extract Lookup Table Attributes” and place it on the sketch. Connect the Calculate Map and Extract Lookup Table Attributes.
Grab two “Get Lookup Table Value” Functors and place it on the sketch. Connect one Extract Lookup Table Attributes to each one of these Get Lookup Table Value Functors to retrieve a value at a specified key: 13 and 21, respectively (Specified in the Key box of the Functor editor window). The first takes the mode of the keys and the second takes the highest value.
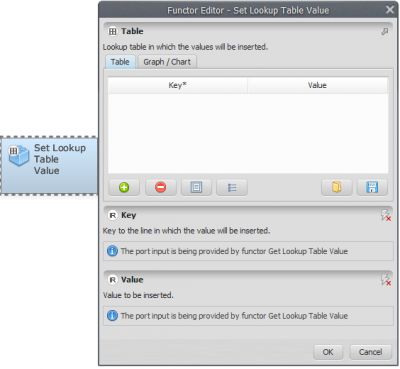
Now, to set values into a lookup table, grab a “Set Lookup Table Value” and place it on the sketch. Connect each Get Lookup Table Value on the Set Lookup Table Value (One is the mode key and other is the max value, i.e. most productive year and maximum productivity, respectively).
 Finally, you need to save the result to a file. Grab a “Save Lookup Table”, place it on the sketch and connect the functor Set lookup table value. Open Save Map, browse to the preferred folder and write the name file (maximum_productive_year_and_productivity.csv).
Mark the eye button at the top of “Save Table” to viewer the results hereafter.
Save and run the model!
Click on the layout tool Left to Right and your final model will look like the one below:

Now, click on eye button of “Save Lookup Table” to see the result. This functor output is table that looks like this:

What does the result say about productivity along the analyzed period? We can infer that 2011 was the most productive year with a productivity of 3.121386 tons/ha.