This is an old revision of the document!
LESSON 3: Exploring the Map Viewer
This lesson presents the Dinamica EGO Map Viewer, the tool designed to view and interpret map information.
The components of the Map Viewer interface are described in more detail in the following sections:
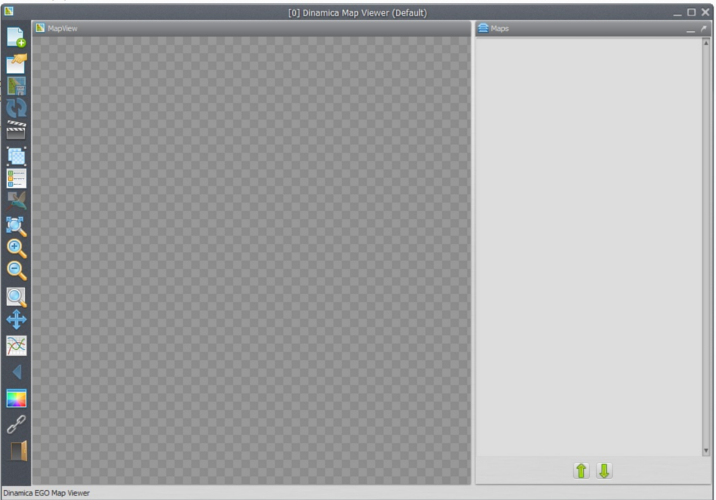
Main Window
The main window is where the most important information regarding the viewer state is located. On the left you have the toolbar related to the viewer state as a whole, on the right you have a list of loaded maps and tools to manage them.
Toolbar
Each toolbar button is described below:
 1) Load map erasing the current stack, load maps using the current stack, replace maps and load saved viewer state.
2) Save viewer state (save transformations, map stack settings, background color and movie maker settings.
3) Save current visualization (including legend and overview map, if visible) as a bitmap image.
4) Reload current selected map.
5) Open movie maker (allow users to make *.mp4 movies from a series of maps in a easy way).
6) Create/Split map groups (grouping maps allow users to apply calculate expressions on top of a custom stack).
7) Toggle map legend (and if image is currently in category mod, toggle categories visualization).
8) Toggle birdview (render a small overview map showing the location of the currently zoomed view).
9) Zoom to fit window.
10) Zoom in (zoom in over hovered cell).
11) Zoom out (zoom out over hovered cell).
12) Zoom to selection rectangle (selected rectangle will cover entire screen space available).
13) Pan (allow users to movement the current visualization area).
14) Analise cells values in specified interval.
15) Previous view (if user is making many visualization steps, you can go back to last step using this button).
16) Background color (change application background color).
17) Toggle geoposition linking between two or more instances of the map viewer.
18) Quit.
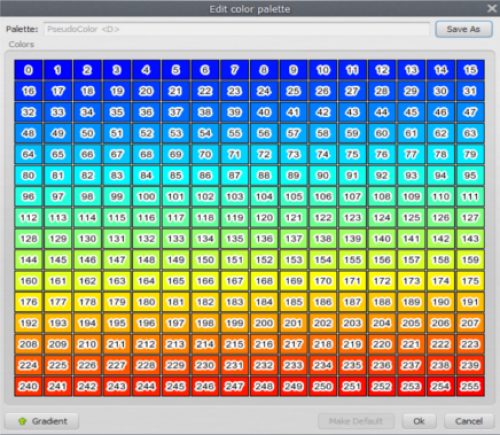
Color Palette
Allow users to select which color represents each cell in visualization area. Cells are first extracted from the map in their original values (in any range) and then re-sampled using the histogram curve. After that, their values fall in the [0, 255] range, which are mapped to palette colors.
Changing colors individually
 The color corresponding to each individual value can be changed by clicking on the corresponding color rectangle. You can also check color index value by hovering your cursor over the color rectangle.
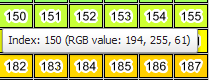
Generated palette
You can also create a palette using a linear interpolation between two color values (gradient). All you have to do is click the gradient button and set your range.

After that, you can click the interpolate button and the new palette view be generated.
Saving your work
Keep in mind that palettes are not saved until the user chooses to do so. If you made any mistake, you can just click “cancel” and try again. If you click Ok, the palette will be changed locally, but will reset if you restart the application.
Saved palettes are stored on the disk in the user palette folder Dinamica EGO/Dmps, so every time you reopen the map viewer, you will still have them. Changes made by the users in predefined palettes only affect their own instance of the application. To reset the predefined palettes to their default state, remove the user palette folder and restart the application.
C:\Users\<User Name>\Documents\Dinamica EGO\Dmps on Windows
Histogram Editor
The histogram window is responsible for assigning transformations from image original values (in any range) to palette range [0, 255]. The histogram curve will adjust any value smaller than the “From:” limit to 0, and any value greater than the “To:” limit to 255. Any other values will be mapped using the histogram curve to the “Y” coordinate on the color palette on the left.
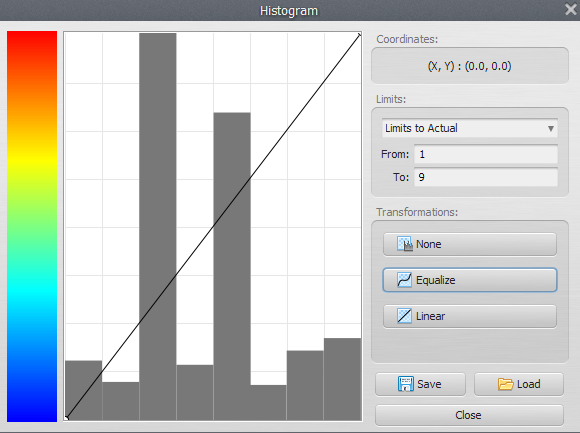
Transformations
- None: The default transformation doesn't map any values, leaving cell values “as is”.
- Linear: This transformation will map linearly any values between the “from” and “to” ranges.
- Equalize: This transformation will construct a curve based on Equalization.
Load a map
There are actually four ways you can load a map (or a group of maps holding the CTRL key on file selection dialog):

| Load map (cleaning map list) | Erase the current map stack (label “Maps” on main dialog). |
|---|---|
| Load map (keeping map list) | Load the new loaded map at the top of the current map stack. Every incompatible map (different number of lines or columns) will be turned off (invisible). Keep in mind that if you open a incompatible map, the current transformation will be erased and the default transformation restored |
| Load map on selection | Load the new map replacing the selected map. This option is only available if there is a map selected. All transformations (histogram, palette, pan, zoom) will be left untouched. The new map will try to match the active map layer selection |
| Load viewer state | Load an stored viewer state from a file, replacing the map stack, the background color, current palettes, histogram transformations and everything else. |
Map loaded, so what?
After your map is loaded, you can see it on the “Maps” stack on the right.
Initially, your map will be loaded Collapsed. We do this because the functionality of each map is contained inside its “row” in the map stack. To expand, just click on the expand arrow.
After expanding, your map will look like this on the map stack. For maps with category information bundled, it will look like this:

You can see a new button, this is just a toggle between “normal” mode and “category” mode. Inside the category mode, the map transformation is ignored and the category colors are used instead. Also, when showing legends in category mode, category colors and names are shown instead of the legend range.
Map information
You can retrieve map information by clicking on the icon “i” (Layer information)
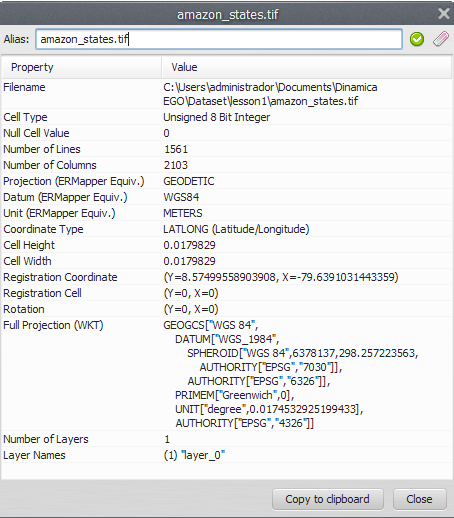
This information comes from Dinamica EGO itself, the available rows can vary from map to map.
Map functions
The functions you have for each map are described below:
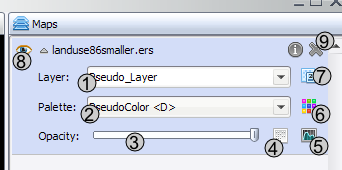 1) Change map layer. If your map has many layers, you can select the active layer to be shown. Only one layer can be use at time.
2) Change map palette.
3) Opacity (by default, viewer show opaque maps, but you can set a transparency threshold and adjust stack to combine maps).
4) Image Expression (calculate expression - just like calculate map on Dinamica EGO - for map values).
5) Histogram transformation.
6) Edit color palette selected on the left combo box (2).
7) Toggle category view (only available for maps with category information).
8) Toggle map visibility.
9) Remove map from stack
How to Make a Movie
Map Viewer can be used to generated movies (in mp4 format) from a set of maps. This is useful because:
- You can make presentations and display temporal changes in a interactive way.
- Output movies can be read by any devices and/or applications that support mp4, it isn't tied to map formats or Dinamica EGO itself.
- Generated frames for movie can be saved separated in PNG, that way you can also use your favorite movie creation tool.
Movie files
On a computer, movies are just a series of frames (or pictures) that get replaced in a particular time frequency.
Usually, when you see formats like (.mp4) it just means you have a set of images and a sound file tied together. With that in mind, movies produced by the Map Viewer follow the same definition. The user is required to load the maps (which are going to be the images in the movie) he wants to display and then configure the viewer main area as if it was the movie itself. Transformations (zoom, pan) are kept on the movie, as well as histogram curves, palettes for each images and transparency.
Making a movie
- User load the maps he/she wants to display on the movie. Check out Load a map, if you are unsure about how to load maps.
- Transformations are configured, histogram curves are defined and color palette set.
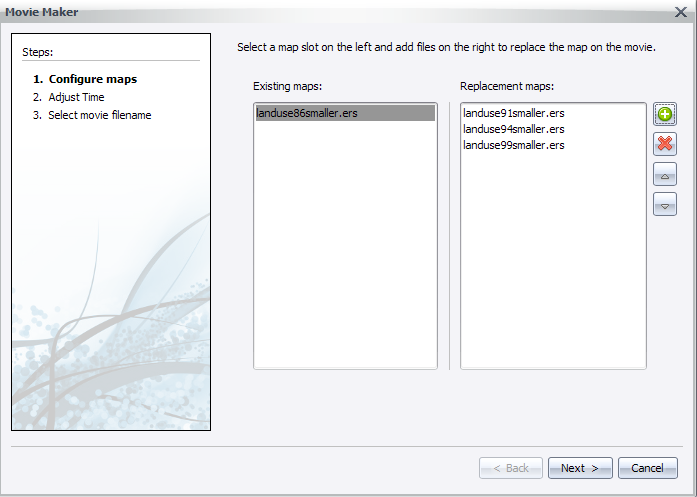
- The movie maker is invoked.

- As soon as the movie maker wizard pops up, the user is prompted to select frames to be replaced (left column) and frames to replace them after each frame (right column).
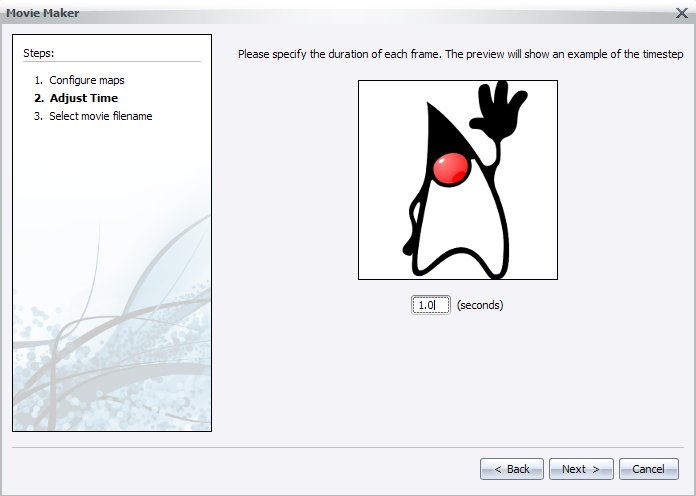
- Next, user configure the time between each frame (a preview of the replace speed will be shown).
- Finally, user select the final path for the output movie file (the .mp4) and if he/she desires to keep generated frames.
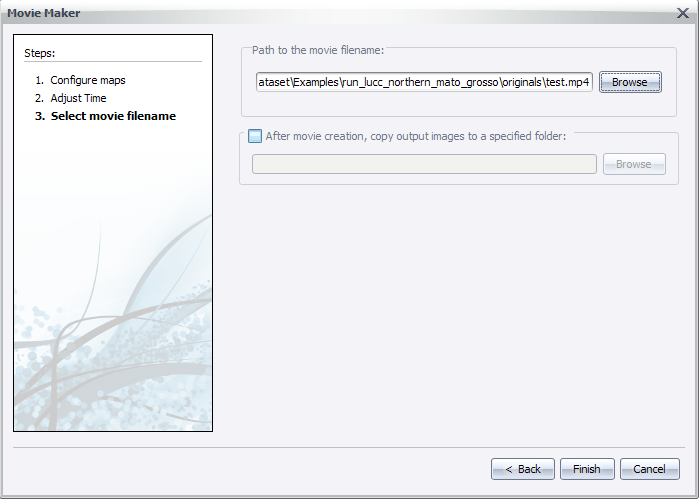
- After clicking next, the user will be prompted to wait while the movie is being generated.

- A good way to keep progress is to watch the changes in frame names, on the Map column in main interface. A notification will pop up when the process finishes.

Map Alias
The Dinamica EGO Map Viewer now offers support for map aliases. By supporting map aliases, map viewer can assign more meaning to the information being displayed.
Setting up alias
- You need a loaded map to assign an alias, if you are unsure about how to load maps, please check Load a map.
- With a map loaded, click on the information icon (
 ) to show selected map information.
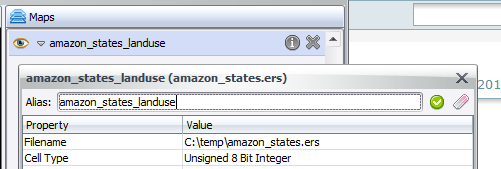
- A dialog will popup and you will be able to change the map alias by writing the new alias on the top text field.
- The alias will be changed when you hit the “Apply map alias” (
 ) or “Restore original alias” (
 ) icons.
- You can also change the map alias by double clicking the map name/alias on the “Maps” window.

- After changing the map alias, you will see the new alias every time a map filename would be shown instead (legend, map information dialog, movie maker).
Command Line
The map viewer can be used as a command line tool to load “.egov” files and save the resulting “.png” image representing the stack of maps.
The command line syntax is:
"<Folder where Dinamica EGO is installed>\DinamicaMapViewer" <egov filename> <resulting png filename> [png width] [png height]
| Parameter | Description |
|---|---|
| egov filename | The filename where the egov file is located. |
| resulting png filename | The filename where the resulting png file will be located. |
| png width | The width of the output png file. This parameter is optional. |
| png height | The height of the output png file. This parameter is optional. |
Example:
"C:\Program Files\Dinamica EGO\DinamicaMapViewer" "c:\Maps\maps.egov" "c:\Outputs\result.png" 800 600